Mayor of Bologna
| Mayor of Bologna | |
|---|---|
| Sindaco di Bologna | |
 | |
 Matteo Lepore since 11 October 2021 | |
| Style | No courtesy or style |
| Seat | Palazzo d'Accursio |
| Appointer | Electorate of Bologna |
| Term length | 5 years, renewable once |
| Inaugural holder | Luigi Pizzardi |
| Formation | 6 April 1860 |
| Deputy | Emily Marion Clancy |
| Salary | €114,960 per year |
| Website | Official website |

The Mayor of Bologna is an elected politician who, along with the Bologna’s City Council, is accountable for the strategic government of Bologna, the regional capital of Emilia-Romagna, Italy.
Overview
According to the Italian Constitution, the Mayor of Bologna is a member of the City Council.
The Mayor is elected by the population of Bologna, who also elects the members of the City Council, the legislative body which checks the Mayor's policy guidelines and is able to enforce his resignation by a motion of no confidence. The Mayor is entitled to appoint and release the members of his executive.
Since 1993 the Mayor is elected directly by Bologna's electorate: in all mayoral elections in Italy in cities with a population higher than 15,000 voters express a direct choice for the mayor or an indirect choice voting for the party of the candidate's coalition. If no candidate receives at least 50% of votes, the top two candidates go to a second round after two weeks. The election of the City Council is based on a direct choice for the candidate with a preference vote: the candidate with the majority of the preferences is elected. The number of the seats for each party is determined proportionally on the base of a majority bonus system.
List of Mayors of Bologna
Kingdom of Italy (1860-1946)
In 1860 the nascent Kingdom of Italy created the office of the Mayor of Bologna (Sindaco di Bologna), chosen by the City council. In 1926, the Fascist dictatorship abolished mayors and City councils, replacing them with an authoritarian Podestà chosen by the National Fascist Party.
| Mayor | Term start | Term end | Party | ||||
|---|---|---|---|---|---|---|---|
| 1 | Luigi Pizzardi | 6 April 1860 | 11 January 1862 | Right | |||
| 2 | Carlo Pepoli | 11 January 1862 | 7 May 1866 | Independent | |||
| 3 | Gioacchino Napoleone Pepoli | 7 May 1866 | 6 April 1870 | Left | |||
| 4 | Camillo Casarini | 6 April 1870 | 3 January 1875 | Left | |||
| 5 | Gaetano Tacconi | 3 January 1875 | 29 March 1890 | Right | |||
| 6 | Carlo Carli | 29 March 1890 | 1 June 1891 | Left | |||
| 7 | Alberto Dallolio | 1 June 1891 | 22 December 1902 | Left | |||
| 8 | Enrico Golinelli | 22 December 1902 | 30 January 1905 | Left | |||
| 9 | Giuseppe Tanari | 30 January 1905 | 21 November 1910 | Right | |||
| 10 | Ettore Nadalini | 21 November 1910 | 15 July 1914 | Left | |||
| 11 | Francesco Zanardi | 15 July 1914 | 21 November 1920 | PSI | |||
| 12 | Enio Gnudi | 21 November 1920 | 4 March 1923 | PSI | |||
| 13 | Umberto Puppini | 4 March 1923 | 26 December 1926 | PNF | |||
| Fascist Podestà (1926-1945) | |||||||
| 1 | Leandro Arpinati | 26 December 1926 | 22 September 1929 | PNF | |||
| 2 | Antonio Carranti | 22 September 1929 | 10 July 1930 | PNF | |||
| 3 | Giovanni Battista Berardi | 10 July 1930 | 1 October 1933 | PNF | |||
| 4 | Angelo Manaresi | 1 October 1933 | 10 July 1936 | PNF | |||
| 5 | Cesare Colliva | 10 July 1936 | 23 November 1939 | PNF | |||
| 6 | Enzo Ferné | 23 November 1939 | 26 August 1943 | PNF | |||
| 7 | Mario Agnoli | 26 August 1943 | 25 April 1945 | PFR | |||
| Liberation (1945-1946) | |||||||
| 14 | Giuseppe Dozza | 25 April 1945 | 7 April 1946 | PCI | |||
Republic of Italy (1946–present)
From 1945 to 1995, the Mayor of Bologna was chosen by the City council. Since 1995, under provisions of new local administration law (1993), the Mayor of Bologna is chosen by direct election, originally every four years, and since 1999 every five years.
| Mayor of Bologna | Took office | Left office | Party | Coalition | Election | |||
|---|---|---|---|---|---|---|---|---|
| 1 | 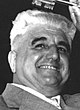 | Giuseppe Dozza (1901–1974) | 7 April 1946 | 2 April 1966 | PCI | PCI • PSI | 1946 1951 1956 1960 1964 | |
| 2 | 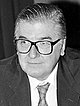 | Guido Fanti (1925–2012) | 2 April 1966 | 29 July 1970 | PCI | PCI • PSI | — | |
| 3 | 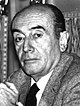 | Renato Zangheri (1925–2015) | 29 July 1970 | 29 April 1983 | PCI | PCI • PSI | 1970 1975 1980 | |
| 4 | 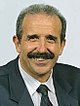 | Renzo Imbeni (1944–2005) | 29 April 1983 | 27 February 1993 | PCI PDS | PCI • PSI | 1985 1990 | |
| 5 | 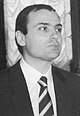 | Walter Vitali (b. 1952) | 27 February 1993 | 24 April 1995 | PDS | PDS • PSI | — | |
| Directly elected mayors (1995–present) | ||||||||
| (5) | | Walter Vitali (b. 1952) | 24 April 1995 | 30 June 1999 | PDS DS | The Olive Tree | 1995 | |
| 6 |  | Giorgio Guazzaloca (1944–2017) | 30 June 1999 | 14 June 2004 | Ind | Pole for Freedoms | 1999 | |
| 7 |  | Sergio Cofferati (b. 1948) | 14 June 2004 | 23 June 2009 | DS PD | The Olive Tree | 2004 | |
| 8 | 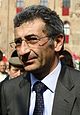 | Flavio Delbono (b. 1959) | 23 June 2009 | 17 February 2010[a] | PD | PD • IdV • FdS • FdV | 2009 | |
| Special Prefectural Commissioner tenure (17 February 2010 – 16 May 2011) | ||||||||
| 9 |  | Virginio Merola (b. 1955) | 16 May 2011 | 20 June 2016 | PD | PD • SEL • IdV | 2011 | |
| 20 June 2016 | 11 October 2021 | PD | 2016 | |||||
| 10 |  | Matteo Lepore (b. 1980) | 11 October 2021[b] | Incumbent | PD | PD • LeU • IV • EV • M5S | 2021 | |
- Notes
- ^ He resigned following the so-called Cinziagate scandal. Until May 2011 the local government was then presided by Anna Maria Cancellieri, a state-appointed commissioner.[1]
- ^ Election originally scheduled for June 2021 then postponed due to the coronavirus pandemic.
Timeline

By time in office
| Rank | Mayor | Political Party | Total time in office | Terms |
|---|---|---|---|---|
| 1 | Giuseppe Dozza | PCI | 20 years, 342 days | 5 |
| 2 | Renato Zangheri | PCI | 12 years, 274 days | 3 |
| 3 | Virginio Merola | PD | 10 years, 141 days | 2 |
| 4 | Renzo Imbeni | PCI | 9 years, 304 days | 2 |
| 5 | Walter Vitali | PDS | 6 years, 123 days | 2 |
| 6 | Sergio Cofferati | DS / PD | 5 years, 9 days | 1 |
| 7 | Giorgio Guazzaloca | Ind | 4 years, 350 days | 1 |
| 8 | Guido Fanti | PCI | 4 years, 118 days | 1 |
| 9 | Matteo Lepore | PD | 2 years, 270 days | 1 |
| 10 | Flavio Delbono | PD | 239 days | 1 |
Elections
City Council elections, 1946–1990
Results
Number of votes for each party:
| Election | DC | PCI | PSI | PLI | PRI | PSDI | MSI | Others | Total |
|---|---|---|---|---|---|---|---|---|---|
| 24 March 1946 | 56,543 (30.3%) | 71,369 (38.3%) | 49,031 (26.3%) | 2,940 (1.6%) | 5,343 (2.9%) | – | – | 1,200 (0.6%) | 186,426 |
| 27 May 1951 | 59,532 (25.8%) | 93,043 (40.4%) | 16,892 (7.9%) | 13,837 (6.0%) | 4,409 (1.9%) | 32,498 (14.1%) | 7,716 (3.6%) | 2,350 (1.0%) | 230,307 |
| 27 May 1956 | 74,388 (27.7%) | 121,556 (45.3%) | 19,955 (7.4%) | 12,380 (4.6%) | 3,412 (1.3%) | 23,290 (8.8%) | 13,407 (5.0%) | – | 268,571 |
| 6 November 1960 | 81,087 (26.7%) | 138,090 (45.6%) | 25,962 (8.6%) | 14,958 (4.9%) | 3,298 (1.1%) | 26,336 (8.7%) | 13,262 (4.4%) | – | 302,993 |
| 22 November 1964 | 73,530 (22.0%) | 149,433 (44.8%) | 25,265 (7.8%) | 36,707 (11.0%) | 1,672 (0.5%) | 27,707 (8.3%) | 11,274 (3.4%) | 8,055 (2.4%) | 333,655 |
| 7 June 1970 | 74,956 (21.3%) | 149,339 (42.5%) | 26,462 (7.5%) | 25,493 (7.3%) | 9,347 (2.7%) | 36,852 (10.5%) | 15,633 (4.6%) | 12,956 (3.7%) | 351,038 |
| 15 June 1975 | 84,840 (23.1%) | 179,622 (49.0%) | 34,178 (9.3%) | 13,535 (3.7%) | 10,659 (2.9%) | 24,509 (6.7%) | 19,067 (5.2%) | – | 366,410 |
| 8 June 1980 | 77,579 (22.5%) | 158,585 (46.0%) | 32,300 (9.4%) | 13,897 (4.0%) | 13,630 (4.0%) | 21,841 (6.3%) | 15,768 (4.6%) | 10,822 (3.1%) | 344,422 |
| 12 May 1985 | 77,199 (22.7%) | 151,113 (44.5%) | 40,969 (12.1%) | 10,009 (3.0%) | 15,372 (4.5%) | 10,469 (3.1%) | 17,976 (5.3%) | 16,409 (4.8%) | 339,516 |
| 6 May 1990 | 65,354 (20.4%) | 124,237 (38.7%) | 44,068 (13.7%) | 9,040 (2.8%) | 17,670 (5.5%) | 5,824 (1.8%) | 12,707 (4.0%) | 47,774 (14.9%) | 320,850 |
Number of seats in the City Council for each party:
| Election | DC | PCI | PSI | PLI | PRI | PSDI | MSI | Others | Total |
|---|---|---|---|---|---|---|---|---|---|
| 24 March 1946 | 19 | 24 | 16 | – | 1 | – | – | – | 60 |
| 27 May 1951 | 10 | 33 | 6 | 2 | 1 | 6 | 1 | 1 | 60 |
| 27 May 1956 | 17 | 29 | 4 | 2 | – | 5 | 3 | – | 60 |
| 6 November 1960 | 17 | 28 | 5 | 3 | – | 5 | 2 | – | 60 |
| 22 November 1964 | 14 | 28 | 4 | 6 | – | 5 | 2 | 1 | 60 |
| 7 June 1970 | 14 | 27 | 4 | 4 | 1 | 6 | 2 | 2 | 60 |
| 15 June 1975 | 14 | 31 | 5 | 2 | 1 | 4 | 3 | – | 60 |
| 8 June 1980 | 14 | 29 | 6 | 2 | 2 | 4 | 3 | – | 60 |
| 12 May 1985 | 15 | 29 | 7 | 1 | 2 | 2 | 3 | 1 | 60 |
| 6 May 1990 | 13 | 25 | 9 | 1 | 3 | 1 | 2 | 7 | 60 |
Mayoral and City Council election, 1995
The election took place on 23 April 1995.
Results
|
| ||||||||||||||||||||||||||||||||||||||||||||||||||||||||||||||||||||||||||||||||||||||||||||||||||||||||||||||||||||||||||||||||||||||||||||||||||||||||||||||||||||||||||||||||||||||||||||||||||||||||||||||||||||||||

Mayoral and City Council election, 1999
The election took place on two rounds: the first on 13 June, the second on 27 June 1999.
Results
|
| |||||||||||||||||||||||||||||||||||||||||||||||||||||||||||||||||||||||||||||||||||||||||||||||||||||||||||||||||||||||||||||||||||||||||||||||||||||||||||||||||||||||||||||||||||||||||||||||||||||||||||||||||||||||||||||||||||||||||

- Notes
- ^ Even if the coalition didn't receive the majority of votes, no other alliance was able to obtain overall more than 50% of votes. Once its mayoral candidate won the second round, the coalition was awarded the majority bonus granted by the electoral law to the alliance whose candidate is elected mayor.
Mayoral and City Council election, 2004
The election took place on 12–13 June 2004.
Results
|
| ||||||||||||||||||||||||||||||||||||||||||||||||||||||||||||||||||||||||||||||||||||||||||||||||||||||||||||||||||||||||||||||||||||||||||||||||||||||||||||||||||||||||||||||||||||||||||||||||||||||||||

- Notes
Mayoral and City Council election, 2009
The election took place in two rounds: the first on 6–7 June, the second on 21–22 June 2009.
Results
|
| ||||||||||||||||||||||||||||||||||||||||||||||||||||||||||||||||||||||||||||||||||||||||||||||||||||||||||||||||||||||||||||||||||||||||||||||||||||||||||||||||||||||||||||||||||||||||||||||||||||||||||||||||||||||||||||||||||||||||||

Mayoral and City Council election, 2011
The election took place on 15–16 May 2011.
Results
|
| ||||||||||||||||||||||||||||||||||||||||||||||||||||||||||||||||||||||||||||||||||||||||||||||||||||||||||||||||||||||||||||||||||||||||||||||||||||||||||||||||||||||||||||||||||||||||||||||||||||||||||||||||||

- Notes
Mayoral and City Council election, 2016
The election took place in two rounds: the first on 5 June, the second on 19 June 2016.
Results
|
| |||||||||||||||||||||||||||||||||||||||||||||||||||||||||||||||||||||||||||||||||||||||||||||||||||||||||||||||||||||||||||||||||||||||||||||||||||||||||||||||||||||||||||||||||||||||||||||||||||||||||||||||||||||||||||||||||||||||||||||||||||||||||||||

Mayoral and City Council election, 2021
The election took place on 3–4 October 2021.
Results
|
| ||||||||||||||||||||||||||||||||||||||||||||||||||||||||||||||||||||||||||||||||||||||||||||||||||||||||||||||||||||||||||||||||||||||||||||||||||||||||||||||||||||||||||||||||||||||||||||||||||||||||||||||||||||||||||||||||||||||||||||||||||||
- Notes
See also
References
- ^ "Delbono e il Cinzia-GateTutto iniziò quando Cazzola". 25 January 2010.
- v
- t
- e
 Mayors of regional capitals of Italy
- Ancona
- Daniele Silvetti (FI)
- Aosta
- Gianni Nuti (centre-left)
- Bari
- Antonio Decaro (PD)
- Bologna
- Matteo Lepore (PD)
- Cagliari
- Massimo Zedda (PP)
- Campobasso
- Roberto Gravina (M5S)
- Catanzaro
- Sergio Abramo (CI)
- Florence
- Sara Funaro (PD)
- Genoa
- Marco Bucci (centre-right)
- L'Aquila
- Pierluigi Biondi (FdI)
- Milan
- Giuseppe Sala (centre-left)
- Naples
- Gaetano Manfredi (centre-left)
- Palermo
- Roberto Lagalla (UdC)
- Perugia
- Vittoria Ferdinandi (centre-left)
- Potenza
- Mario Guarente (LN)
- Rome
- Roberto Gualtieri (PD)
- Turin
- Stefano Lo Russo (PD)
- Trento
- Franco Ianeselli (centre-left)
- Trieste
- Roberto Dipiazza (FI)
- Venice
- Luigi Brugnaro (CI)


